Boost Profitability with Data-Driven Courier Insights
Unlock the power of real-time sales analytics and performance trends to optimize your logistics business. Our Daily Sales Report provides deep visibility into parcel shipment revenue, carrier performance, and regional sales trends—helping you make smarter decisions with automated KPI dashboards and actionable business intelligence.


Drive Growth with Our Daily Sales Analytics Software
- Real-time sales dashboards tracking parcel shipment revenue, delivery metrics, and carrier performance
- Automated KPI reports with trend analysis for logistics business intelligence
- Multi-carrier sales comparisons to identify top-performing services and regions
- Customizable analytics for ecommerce logistics, B2B freight, and last-mile delivery
Data-Driven Sales Analytics That Power Your Logistics Business
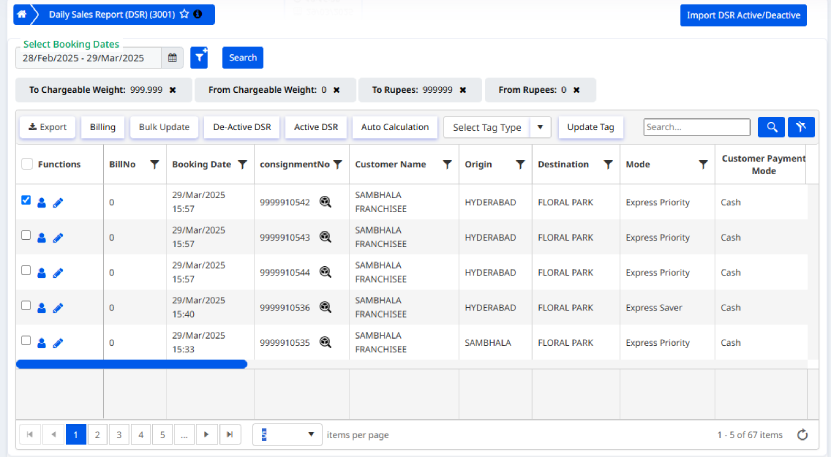
Our advanced daily sales report software gives you complete financial visibility across your operations. The logistics performance dashboard provides real-time sales analytics through integrated shipping business intelligence, consolidating all your revenue streams in one view.
Key features visible in this interface:
• Parcel shipment revenue tracking with comparative period analysis
• Carrier performance report showing cost vs. profitability
• Delivery service metrics correlated with sales performance
• Interactive courier KPI dashboard for executive insights
Our logistics data visualization dashboard provides actionable sales trend analysis
Our Daily Sales Report (DSR) transforms your logistics operations into a profit-driven powerhouse. By leveraging daily shipping analytics and shipping business intelligence, you gain real-time visibility into parcel shipment revenue across all services and regions. The logistics performance dashboard reveals actionable insights through sales trend analysis, helping you identify high-margin routes, optimize pricing strategies, and reduce inefficiencies. Track delivery service metrics alongside financial performance to align operations with profitability goals. With our carrier performance report, compare vendor costs versus revenue impact to make data-driven partnership decisions. The courier KPI dashboard simplifies complex data through intuitive logistics data visualization, enabling quick decisions on capacity planning and resource allocation. Whether you need to monitor ecommerce fulfillment trends or analyze B2B freight profitability, our courier sales report delivers the metrics that matter—turning raw data into competitive advantage.
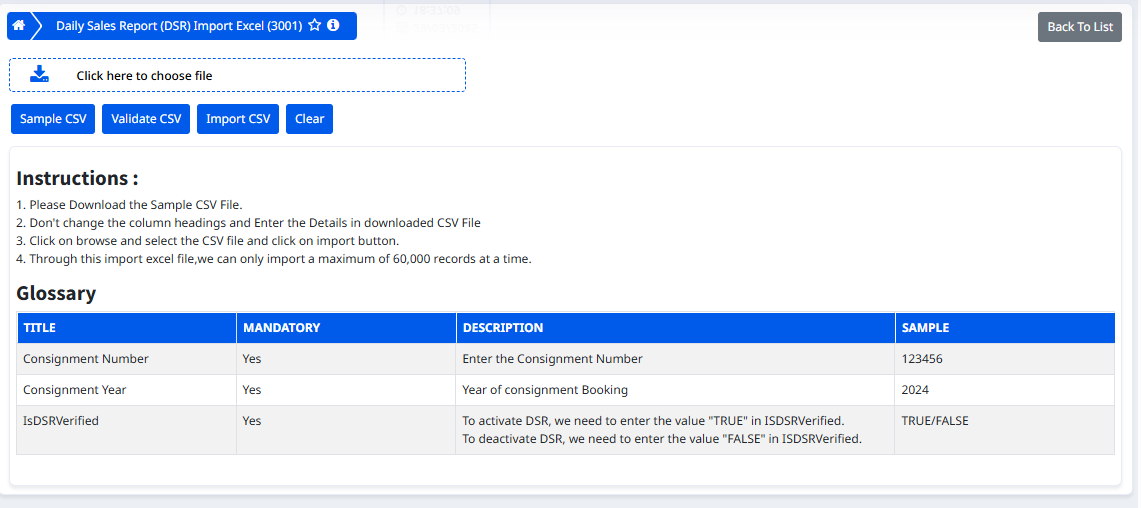
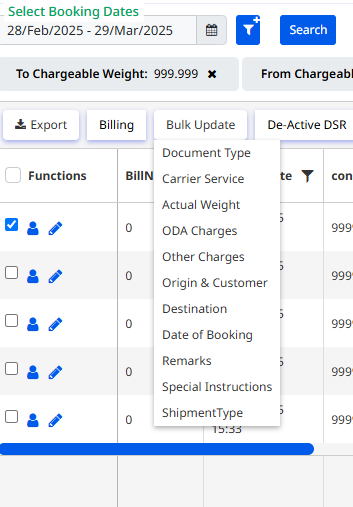
Eliminate manual data entry with our intelligent DSR automation. Update your daily shipping analytics in bulk with our CSV import tool—validate files for accuracy before processing to ensure flawless logistics data visualization. Our dedicated import screen lets you review and correct discrepancies in parcel shipment revenue, delivery service metrics, and carrier performance reports before they hit your courier KPI dashboard. One click processes multiple records simultaneously, transforming raw data into actionable shipping business intelligence while maintaining data integrity for your courier sales report. The system automatically flags anomalies in your sales trend analysis, helping you maintain pristine accuracy across your entire logistics performance dashboard.
